

Pulling Search Console exports into one spreadsheet and Google Ads metrics into another wastes a morning every reporting cycle in 2026. Connect both sources inside Looker Studio instead, and the same weekly update becomes one dashboard refresh instead of two manual pulls.
- Looker Studio blends Search Console and Google Ads data into one table, replacing manual exports with a single report.
- This looker studio seo and ads reporting workflow joins both sources on date, not on a shared ID — get that join wrong and totals double-count.
- Search Console data carries a 2-3 day processing lag Google Ads doesn't; build the date filter around that gap before anything else.
- Add GA4 on top and the same report covers traffic, rankings, ad spend and conversions in one view.
- Google Search Console keeps 16 months of history natively — the connector can't pull further back than that.
Why this matters
Most agencies and in-house marketers run SEO reporting and Ads reporting as two separate habits: a Search Console CSV on Monday, an Ads export on Wednesday, a manual VLOOKUP to line them up by date. Every step is a place the numbers drift out of sync.
A blended Looker Studio report removes the drift because both sources pull live from the same canvas, refreshed on the same schedule. It's also the same groundwork a Search Console to Google Ads workflow depends on — this guide builds the reporting layer on top of that connection, not instead of it.
The payoff isn't cosmetic. When organic clicks and ad spend sit on the same timeline, a founder sees in seconds whether a ranking drop coincided with a Google Ads budget cut, or whether a traffic spike came from an algorithm update rather than the campaign someone just launched.
Before you start
- A Looker Studio account signed in with the same Google identity that has access to the Search Console property and the Google Ads account (or Editor access shared from the account owner).
- At least Read-only access on the Ads account. Viewer-only roles on some MCC structures will block the connector from authorising.
- The gotcha: Search Console exposes data per verified property. A domain property (sc-domain:example.com) and a URL-prefix property (https://www.example.com) for the same site are two different data sources in Looker Studio. Pick one before you build the blend — mixing them produces duplicate rows and clicks that look doubled.
Connect your Search Console data source
- In Looker Studio, click Create, then Data source.
- Search for the Search Console connector and select it.
- Choose the property you verified — Site URL for a URL-prefix property, or Domain for a domain property.
- Pick the URL Impressions table for page-level detail, or Site Impressions for query-level detail.
- Click Connect, then Add to report.
Expected result: a table with queries or pages, clicks, impressions, CTR and average position, filterable by date range.
Connect your Google Ads data source
- Click Create, then Data source again.
- Search for the Google Ads connector.
- Sign in and select the account — an MCC manager account or a single Ads account, depending on setup.
- Choose the Ads Campaign report for spend-level reporting, or the Ads Search Keyword report if you need keyword-level cost and conversion data.
- Click Connect.
Expected result: a table with campaign name, cost, clicks, impressions and conversions, ready to drop into a chart.
Blend both sources into one table
- On the report canvas, open Resource, then Manage blended data — or start from a chart's Edit menu and choose Blend data.
- Add the Search Console table as the first source.
- Add the Google Ads table as the second source.
- Join on the Date dimension. Because Search Console data lags 2-3 days behind real-time Ads data, set the report's date range control to end 3 days before today, or the most recent days will show organic clicks as zero while ad spend keeps populating.
- Pull metrics from both sources into the blend: organic clicks, impressions and position from Search Console; cost, conversions and ad clicks from Google Ads.
Expected result: one table where a single date row shows both organic and paid performance side by side.
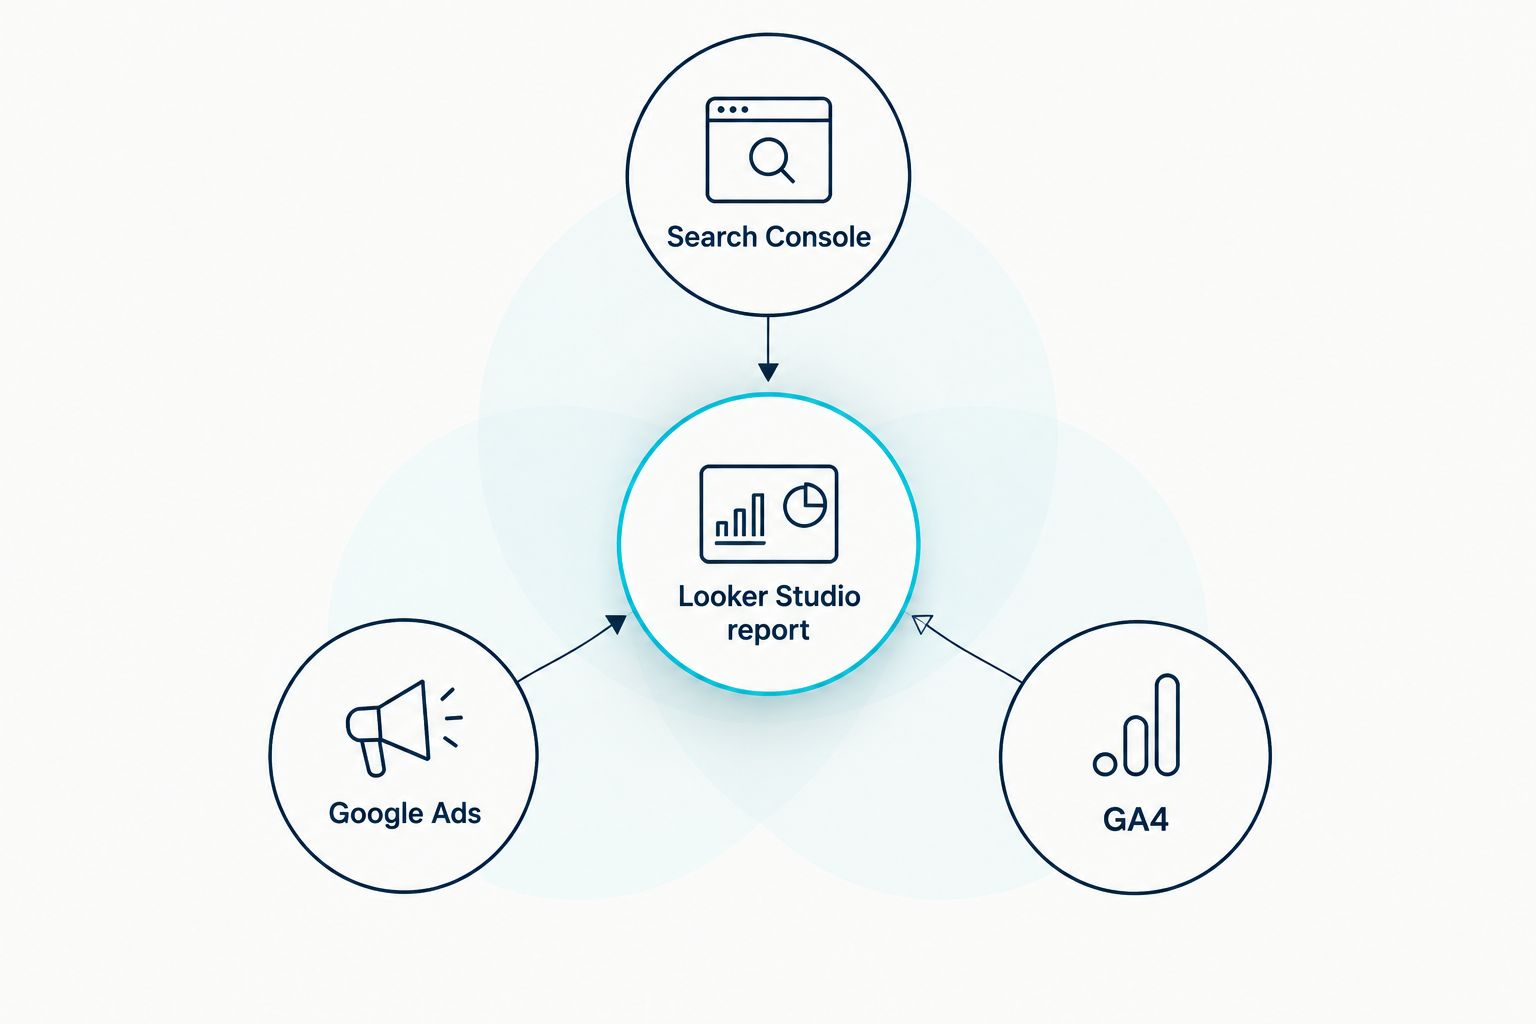
Build the one-view dashboard
- Add a Scorecard chart for top-line organic clicks, a second for ad cost, a third for conversions.
- Add a Time series chart using the blended source: organic clicks as a line, ad spend as a bar, same axis.
- Add a Table chart filtered to the top 20 rows by impressions, so query or page-level detail sits below the summary.
- Add a date range control and sync it across every chart on the page, so one filter change updates the whole view.
Expected result: a single page that shows organic and paid performance together, readable in under a minute instead of across two spreadsheets.
Need this built for you?
Digital Womble sets up the blend, the date logic and the dashboard once, correctly.
Add GA4 conversions for the full picture
The workflow above covers traffic and spend. Add a third connector — GA4 — whenever revenue or lead attribution needs to sit in the same view.
- Create a third data source using the Google Analytics connector, select the GA4 property, and choose the standard report or an exploration if conversion events are custom.
- Blend GA4 sessions and conversions into the existing table, joining on Date and, where available, Landing page.
- Add a conversion-value scorecard next to the cost scorecard already on the page.
This variant answers a different question than the first: not just "did traffic and spend move together" but "did either one actually produce revenue." It pairs naturally with a GA4 to Search Console workflow if GA4 isn't connected to Search Console data elsewhere yet, and with a dedicated Google Ads to Google Analytics lead attribution setup when the conversion needs to be traced back to the exact campaign.
Troubleshooting
- Blended table shows zero organic clicks for the last 1-2 days. This is the 2-3 day Search Console lag, not a broken connection. Set the date range control to exclude the most recent days.
- Numbers in the Looker Studio report don't match the native Google Ads dashboard. The Ads connector defaults to Google Ads' own attribution model, which can differ from GA4's data-driven model if GA4 conversions are blended in too. Check which attribution model each number in the report is actually reading from.
- A scorecard shows "No data." Usually an access issue — the Google account connecting the data source doesn't have access to that specific property or Ads account. Re-share access and refresh the data source.
- Domain property and URL-prefix property both show up as separate Search Console sources. Standardise on one property type for all future reports; rebuilding the blend on the wrong property duplicates rows.
- The report loads slowly with multiple blends on one page. Convert the heaviest blend into an extracted data source rather than a live blend — it trades a little freshness for load speed.
Customise the workflow
Once the base report works, extend it rather than leaving it as-is:
- Filter the Search Console table to branded vs non-branded queries to separate organic brand lift from genuine ranking gains.
- Layer in a rank-tracking data source if you're already paying for one — compare options on the best rank tracking tools for SEO agencies page before adding a new subscription.
- If this report serves client accounts rather than a single business, check how other agencies structure client-facing dashboards on the best SEO reporting tools for client agencies page — Looker Studio is one option among several, and which one fits depends on how many clients the report needs to serve.
FAQ
What's the best way to combine Search Console and Google Ads in Looker Studio?
Blend the two connectors on the Date dimension inside Looker Studio's Manage blended data screen. Set the date range to exclude the most recent 2-3 days, since Search Console data lags behind Google Ads in processing.
Is Looker Studio better than exporting to a spreadsheet for SEO and Ads reporting?
Looker Studio removes the manual export-and-merge step because both connectors refresh on schedule inside one report. A spreadsheet still works for one-off analysis but drifts out of date between updates.
Why does my blended Looker Studio report show zero organic clicks for the last two days?
Search Console data has a 2-3 day processing lag. Set the report's date range control to end 3 days before today rather than today.
Can I add GA4 to a Looker Studio SEO and Ads report?
Yes. Add the Google Analytics connector as a third data source and blend it on Date and Landing page alongside Search Console and Google Ads. This adds revenue and conversion data to the same view.
Do I need a domain property or URL-prefix property for the Search Console connector?
Use whichever property you verified in Search Console, and stick to one type. Mixing a domain property and a URL-prefix property for the same site in one report produces duplicate rows.
How far back does Looker Studio's Search Console data go?
As far back as Google Search Console itself retains, which is 16 months. The connector can't pull data Search Console has already rolled off.
Why don't my Looker Studio numbers match the native Google Ads dashboard?
Different attribution models. The Google Ads connector defaults to Google Ads' own model, while a blended GA4 source may use a data-driven model, producing different conversion counts for the same campaign.
What access do I need to build this report?
Verified ownership or delegated access on the Search Console property, and at least Read-only access on the Google Ads account. Viewer-only roles on some account structures will block the connector.
One last thing
Search Console only keeps 16 months of history inside the connector — if the report needs to compare this year against the same month three years ago, that data has already rolled off and Looker Studio can't retrieve it. Export the raw data to BigQuery before it ages out if long-range year-over-year comparison matters for 2026 reporting and beyond.