

Google PageSpeed Insights is the best page speed testing tool for free, official Core Web Vitals data in 2026. WebPageTest wins for deep diagnostic testing across real browsers and global locations. GTmetrix and DebugBear win for tracking speed trends over weeks rather than single snapshots.
- Google PageSpeed Insights is the best free page speed testing tool for official Core Web Vitals scoring in 2026.
- WebPageTest gives the deepest diagnostics: multiple locations, real devices, full waterfall charts.
- GTmetrix and DebugBear track speed trends over time; one-off tools like PageSpeed Insights and Pingdom don't.
- INP replaced FID as a Core Web Vital in March 2024, and most page speed testing tools still report it separately from LCP and CLS.
- Pick a tool by what you're testing: a single page, a pre-launch check, or ongoing monitoring across dozens of URLs.
Why page speed testing tools matter in 2026
Page speed is a ranking input and a conversion lever at the same time. Google folds Core Web Vitals into how it evaluates page experience, and slow pages lose paid traffic too — a poor page experience score drags down Quality Score in Google Ads, which raises cost per click. Digital Womble's technical SEO audits flag slow pages as a recurring cause of lost organic and paid revenue, long before a client asks about speed directly.
Testing tools disagree with each other because they measure different things. Lab tools run a scripted test on a fixed connection. Field tools report what real visitors actually experienced over the past 28 days. A page can pass in the lab and fail in the field if real users are on slower connections or older phones than the test simulates.
That gap is why trusting one page speed testing tool blindly is a mistake in 2026.
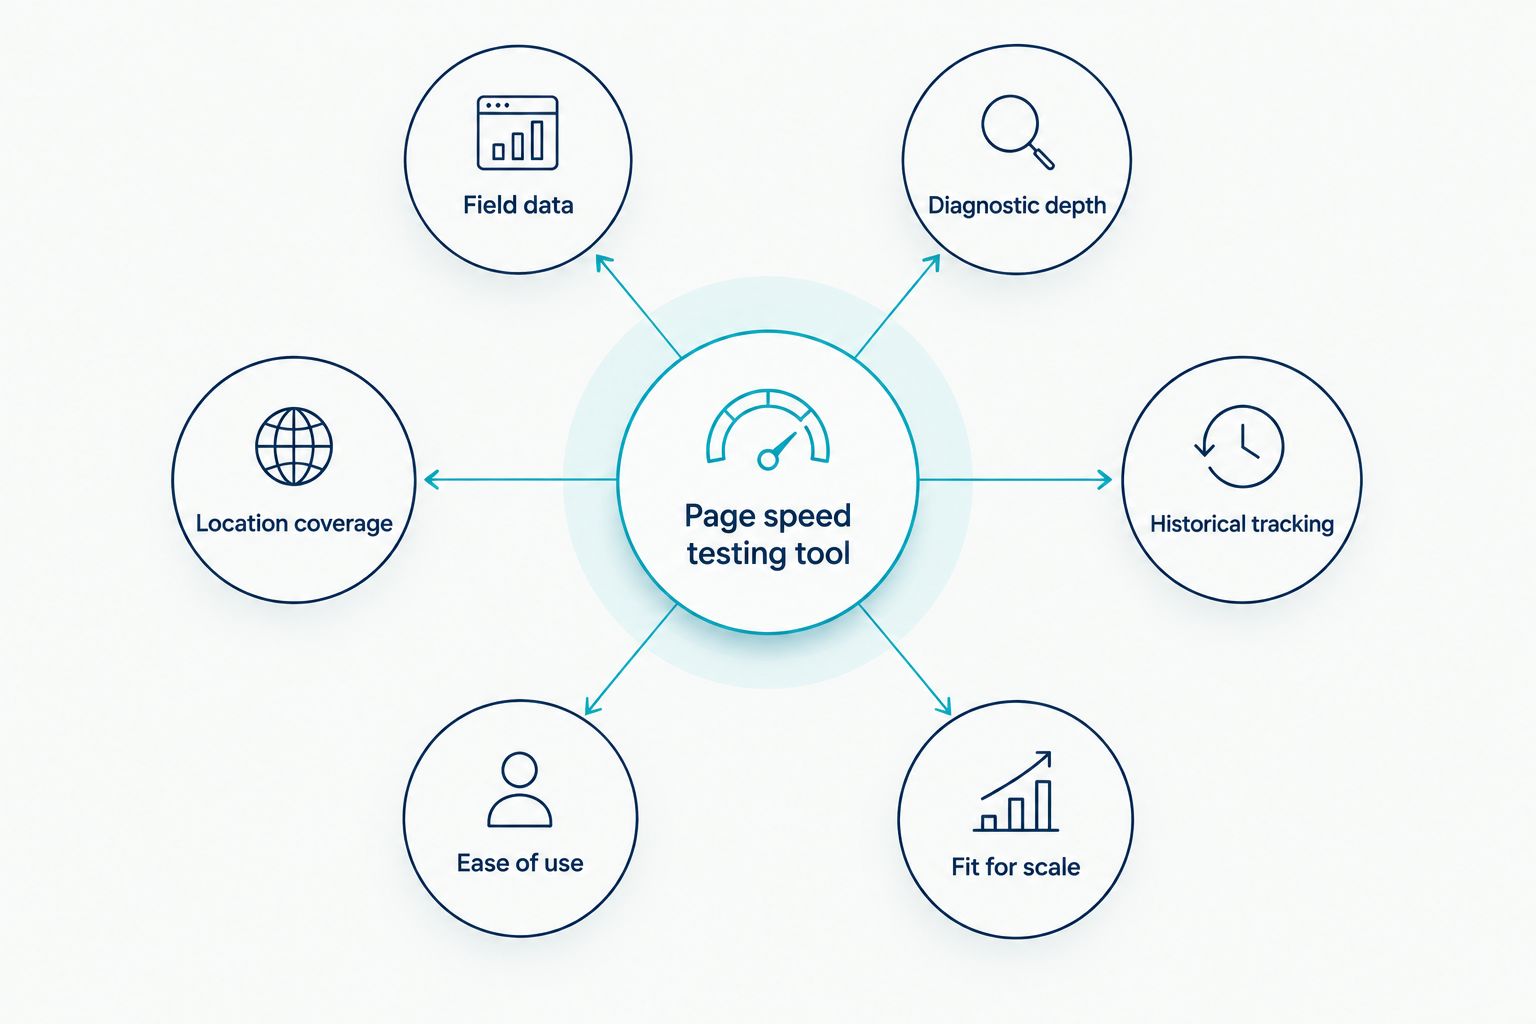
What makes the best page speed testing tool
- Field data, not just lab data — real Core Web Vitals from actual visitors (Chrome UX Report), not just a single scripted run
- Diagnostic depth — waterfall charts and a request-by-request breakdown, not just a score
- Test location and device coverage — multiple regions and connection speeds, since a UK visitor on 4G sees a different page than a lab server on fibre
- Historical tracking — trend lines over weeks and months, so a regression shows up before a client notices
- Ease of use — a score and fix list a non-developer can act on without translation
- Fit for scale — testing one URL is a different job to monitoring 200 URLs across a site
Page speed testing tools at a glance
| Tool | Best for | Standout feature | Key limitation |
|---|---|---|---|
| Google PageSpeed Insights | Official Core Web Vitals data | Combines lab and CrUX field data in one report | Field data disappears for low-traffic pages outside CrUX |
| WebPageTest | Deep diagnostic testing | Real browsers and devices from dozens of global locations | Dense output that takes practice to read |
| GTmetrix | Tracking speed trends over time | Historical graphs alongside a letter grade | Free plan tests from a single location |
| Chrome DevTools (Lighthouse panel) | Pre-launch developer testing | Runs instantly, offline, before a page goes live | Lab data only, no real-user field data |
| Pingdom Website Speed Test | Quick non-technical checks | Simple load time breakdown anyone can read | Fewer diagnostic details than WebPageTest |
| DebugBear | Agency-level monitoring across many pages | Alerts on Core Web Vitals regressions automatically | Built for ongoing monitoring, not one-off spot checks |
1. Google PageSpeed Insights: best page speed testing tool for official Core Web Vitals data
Google PageSpeed Insights runs a Lighthouse audit against a URL and layers in real-user Core Web Vitals from the Chrome UX Report when the page has enough traffic. It's the same data source Google Search Console uses to flag Core Web Vitals issues, so a page that passes here is a page Google itself treats as fast.
Google PageSpeed Insights pros:
- Free, no account required, results in under a minute
- Field data (CrUX) and lab data (Lighthouse) shown side by side
- Direct alignment with how Search Console reports Core Web Vitals
Google PageSpeed Insights cons:
- Field data disappears for pages without enough CrUX traffic, leaving only the lab score
- No historical trend view — every test is a fresh snapshot
- Single test location, so it doesn't reflect regional connection speed differences
Best for: teams that want the same speed data Google uses to rank the page, in one free check.
Verdict: use it as the first stop for every page speed testing task in 2026.
2. WebPageTest: best page speed testing tool for deep diagnostic testing
WebPageTest runs tests on real browsers and real devices from dozens of locations worldwide, with full control over connection throttling, number of test runs, and video capture of the page loading. It produces a waterfall chart showing every request, in order, with timing.
WebPageTest pros:
- Genuine device and browser testing, not just simulated conditions
- Global test locations show how a page performs for visitors outside the UK
- Waterfall view pinpoints exactly which request or script delays render
WebPageTest cons:
- Steep learning curve — the report has more metrics than most teams need
- No built-in historical dashboard without setting up scheduled tests separately
- Slower to run than a one-click PageSpeed Insights test
Best for: developers debugging a specific rendering or request-order problem.
Verdict: use it when PageSpeed Insights flags a problem but doesn't explain why.
3. GTmetrix: best page speed testing tool for tracking speed trends over time
GTmetrix scores a page with its own grade and reports Core Web Vitals alongside it, but its real value is the trend graph — a page tested weekly builds a history that shows whether a redesign, plugin, or new ad script made things worse.
GTmetrix pros:
- Historical graphs turn one-off scores into a trend
- A to F grade is easy to explain to a non-technical stakeholder
- Waterfall and video playback included alongside the score
GTmetrix cons:
- Free plan tests run from a single location (Vancouver), which skews results for a UK audience
- Scheduled monitoring and more locations sit behind an account tier
- The letter grade weights differently from Google's own Core Web Vitals scoring, so the two can disagree
Best for: agencies that need to prove a fix worked, not just diagnose the problem.
Verdict: use it once a page speed testing task graduates from spot check to ongoing tracking.
4. Chrome DevTools Lighthouse panel: best for pre-launch developer testing
The Lighthouse panel built into Chrome DevTools runs the same audit engine as PageSpeed Insights, but locally, instantly, and offline. A developer can test a page on a staging server before it's public.
Chrome DevTools pros:
- No network round trip — results in seconds, works on localhost and staging
- Same scoring engine as PageSpeed Insights, so results are directly comparable
- Throttling presets simulate slow connections without leaving the browser
Chrome DevTools cons:
- Lab data only — no real-user field data, ever
- Results shift with the tester's own machine load and background processes
- Not useful for testing live production traffic patterns
Best for: developers checking a page before it ships, not after.
Verdict: use it in the build pipeline, before a page reaches production.
5. Pingdom Website Speed Test: best for quick non-technical checks
Pingdom's speed test gives a load time, page size, and request count breakdown in a format built for someone without a development background to read in thirty seconds.
Pingdom pros:
- Clear, simple output — no jargon-heavy report to interpret
- Fast single test, good for a quick check before a meeting
- Page size and request count call out obvious bloat, like unoptimised images or too many scripts
Pingdom cons:
- Less diagnostic depth than WebPageTest — it tells you a page is slow, not always why
- Single test location per run limits how representative the result is
- Core Web Vitals reporting is thinner than PageSpeed Insights
Best for: a founder or marketer who wants a fast answer without learning a new tool.
Verdict: use it for a gut check; move to PageSpeed Insights or WebPageTest for anything actionable.
6. DebugBear: best page speed testing tool for agency-level Core Web Vitals monitoring
DebugBear tracks Core Web Vitals across an entire site on a schedule and alerts on regressions, which matters when a site has hundreds of URLs and no one is manually re-testing each one after every deploy. Agencies running technical SEO audits across e-commerce catalogues, including Digital Womble's own audits, lean on tools built for scale rather than one-off checks.
DebugBear pros:
- Continuous monitoring catches a regression the week it happens, not months later
- Competitor benchmarking shows where a site sits against named rivals
- Built for teams managing Core Web Vitals across many URLs, not one page
DebugBear cons:
- Positioned for ongoing monitoring, not one-off spot checks — overkill for a single page
- Requires a paid subscription to run continuously; there's no free tier built for scale
- Setup takes longer than any single-URL tool on this list
Best for: agencies running technical SEO audits across large or e-commerce sites.
Verdict: use it once a site has enough pages that manual re-testing stops being realistic.
How we ranked
Each tool was measured against the six criteria above: field data availability, diagnostic depth, location and device coverage, historical tracking, ease of use, and fit at scale. No tool wins on every criterion — that's the point of ranking six tools by distinct use case instead of one universal pick. Google PageSpeed Insights wins on field data because it's the only tool tied directly to CrUX and Search Console. WebPageTest wins on diagnostic depth because nothing else on this list matches its location and device coverage. GTmetrix and DebugBear split the historical tracking win between one-page and many-page use cases.
Which page speed testing tool should you choose?
Start with Google PageSpeed Insights — it's free, it's fast, and it's the same data Google uses to judge the page. If PageSpeed Insights flags a problem and the fix isn't obvious, run the same URL through WebPageTest for the waterfall detail that shows which request is actually slow. If a site has more than a handful of pages that need watching through 2026, add GTmetrix or DebugBear for the trend line — a single score means nothing without a comparison to last month sitting next to it. Digital Womble treats page speed as one input in a technical SEO audit, not the whole audit, and tests every client page against both lab and field data before recommending a fix.
Get a technical speed audit
Digital Womble reviews Core Web Vitals against ad spend and rankings impact.
FAQ
What is the best page speed testing tool in 2026?
Google PageSpeed Insights is the best overall page speed testing tool in 2026 because it's free and uses the same Core Web Vitals data Google uses to rank pages. WebPageTest is better for deep diagnostics, and GTmetrix or DebugBear are better for tracking trends over time.
Is Google PageSpeed Insights accurate?
Google PageSpeed Insights is accurate for pages with enough traffic to appear in the Chrome UX Report, since that field data reflects real visitors. For low-traffic pages it falls back to lab data only, which can differ from what real users experience.
What's the difference between lab data and field data?
Lab data comes from a single scripted test run on fixed conditions, while field data comes from real visitors over the past 28 days via the Chrome UX Report. A page can score well in the lab and still fail in the field if real users are on slower connections.
Do I need more than one page speed testing tool?
Most sites need at least two: one for official Core Web Vitals scoring, like Google PageSpeed Insights, and one for deeper diagnostics, like WebPageTest, when a fix isn't obvious from the score alone.
What are the Core Web Vitals thresholds in 2026?
Google's Core Web Vitals thresholds for a "good" score are 2.5 seconds for LCP, 200 milliseconds for INP, and 0.1 for CLS. INP replaced FID as the official responsiveness metric in March 2024.
Is GTmetrix free?
GTmetrix has a free plan that runs tests from a single location, and paid tiers that add more test locations, scheduled monitoring, and longer history.
Does page speed affect Google Ads quality score?
Yes, page experience feeds into Quality Score in Google Ads, and a slow landing page typically raises cost per click for the same ad position.
How often should you test page speed?
Test after every major deploy, plus a scheduled check at least monthly if you're not running continuous monitoring. Sites with frequent releases benefit from a tool like GTmetrix or DebugBear that tracks the trend automatically.
One last thing
Google replaced FID with INP as an official Core Web Vital metric in March 2024, and plenty of teams testing page speed in 2026 still read INP as an optional add-on rather than a ranking input. Check INP first on any page with heavy client-side JavaScript — sticky headers, custom dropdowns, and third-party chat widgets are the usual culprits, and none of them show up in a plain load-time number.